Research, research, research. Before you even scribble a line down on paper, you have to do research. UX Design is extremely methodical work but I actually find this enjoyable. I like knowing I have data backing up my design choices.
The following project is for a Hotel Booking platform where I demonstrate my understanding of UX Design process. For every stage you can click and view the completed project.
Competitive Benchmarking
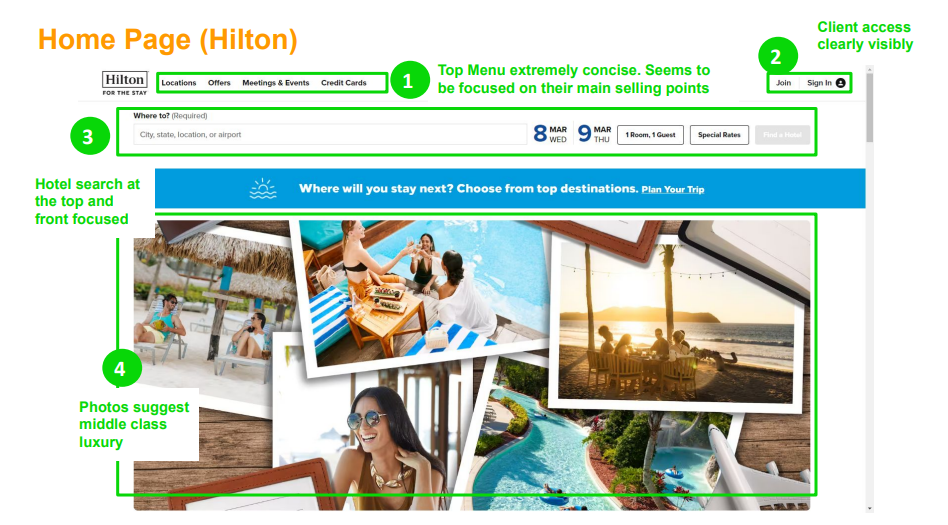
The very first step of the project was something called Benchmarking. This involved finding 2 to 3 other competitors in the field that you were researching and then reviewing the websites to identify industry best practises – or things that you note are just not working. It’s an excellent starting point and one that reveals a lot of insight on industry standards.
As this was a Hotel Booking Platform, I chose four of the major players in the market. Hilton, Marriott, Ibis and Travelodge.
Surveys
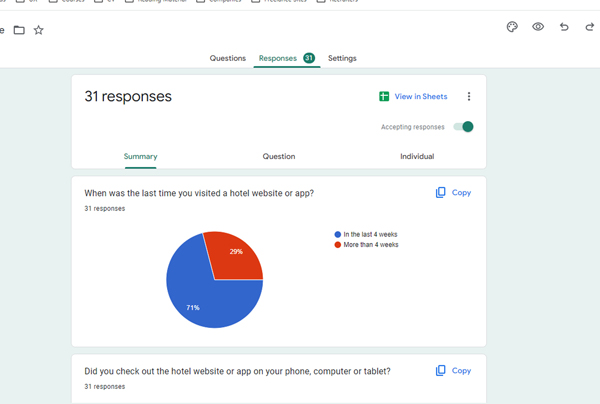
Decisions on design can be made on user feedback. It’s very important to note that surveys should never be done to ask a user ‘what will you do’ but ‘what did you do’ or ‘how did you feel’. User preferences are a tricky thing to identify and people generally do not know what they actually would do in any given situation, they do tend to remember their past experience however and this is the area to focus on. If you can conduct your survey’s in a way to identify a useful trend, this is data you can use to guide your design choices.
Is this survey, I asked structured and unstructured questions. Structured to get quantitative data on a specific aspect of their booking approach (eg: did they book on a computer, mobile or tablet?) and unstructured to get insight on a users past experience (i.e. identifying something they really hated when booking on the site)
Usability Testing
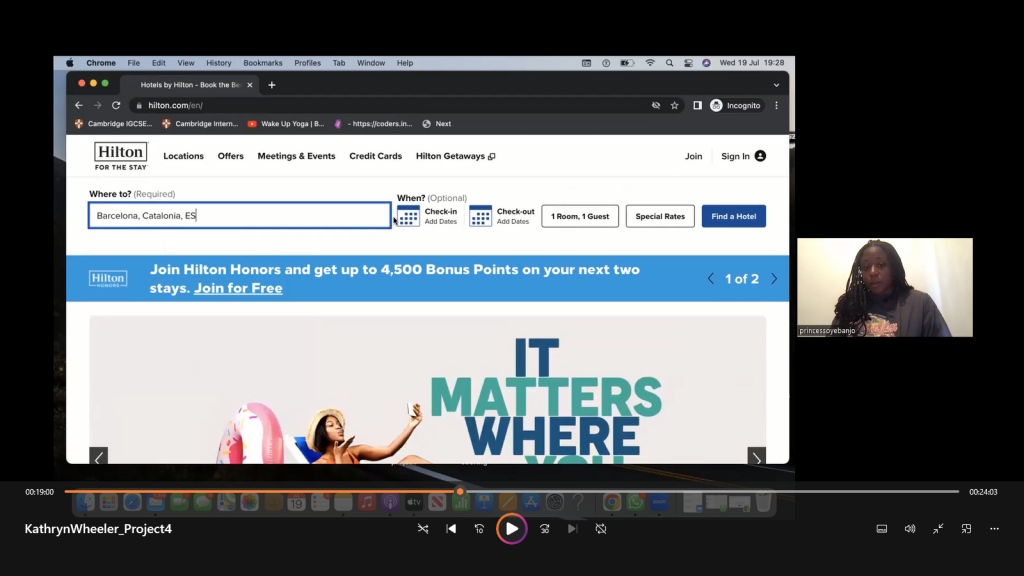
You will never know how your product really works or how a user reacts to your design choices until you see it with your own eyes. Usability testing is an invaluable method of getting this raw, unfiltered data from an actual user who you can guide in front of your eyes. Asking them a specific set of questions for one particular user flow. If you are working on a new product, you might not have a live website or product to work with but you can still do this research from a competitors website.
For this test, I chose two websites. Ibis and Hilton hotel and with a volunteer user I guided them through a set of pre-prepared questions, focusing on a simple booking flow of one or two destinations. The tool used was Zoom.
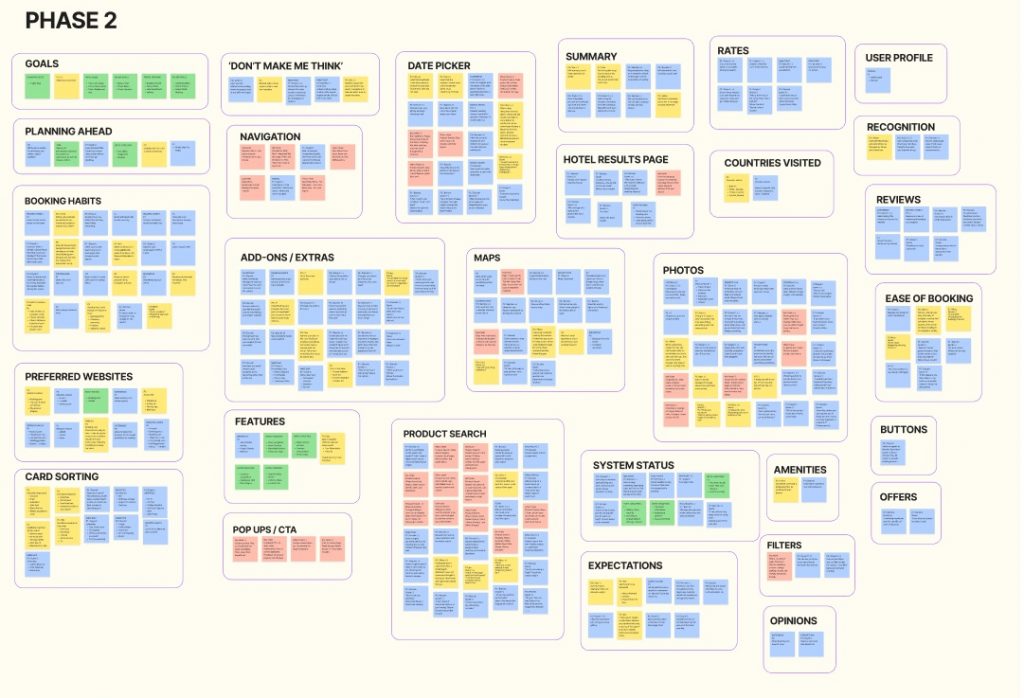
Affinity Diagram
Understanding and grouping data is messy. Depending on how big your project is, it can take a while and if you haven’t done the previous steps properly you won’t have as much data to work with. Which can lead to guessing or presumptions.
To really get a visual representation of the data you have gathered in your research, a useful analysis tool called an affinity diagram is used. Trends or patterns are grouped together, giving you a clearer picture of different aspects of the user experience.
Customer Journey Map
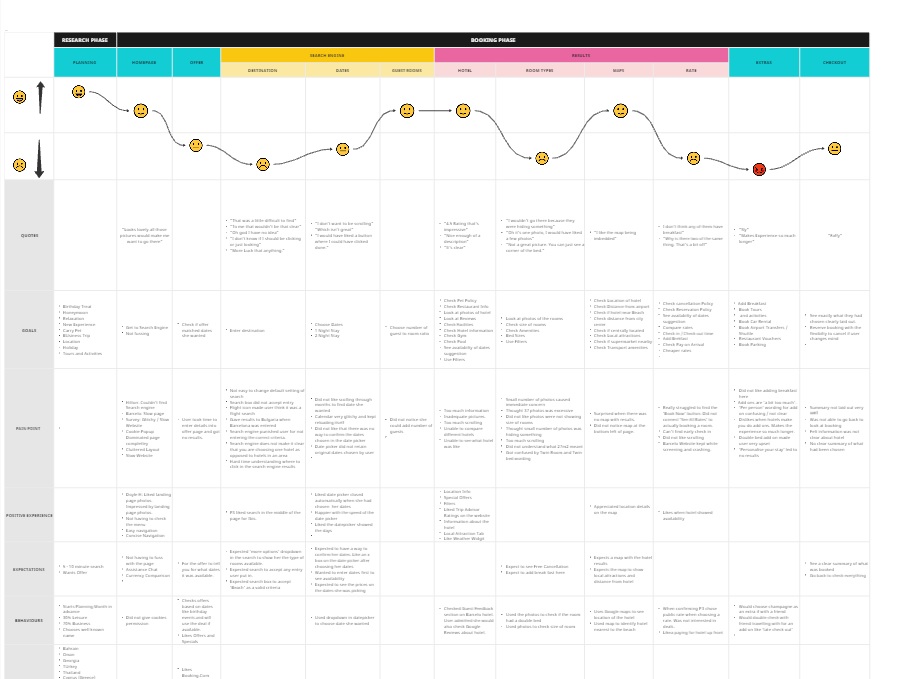
Having grouped the data into different categories, we now reached the part of the project where have to present the data in a structured document that better represent the high level steps a user encounters as they flow through your product. Every journey map will be different as every product is different but for this, we had the planning (or research phase) and booking phase, all broken down into their own smaller subcategories. Using the data gathered, you can then ‘map’ what the user was experiencing as they did their booking. Their goals, Pain points, positive experience, expectations etc.
Flow Diagram
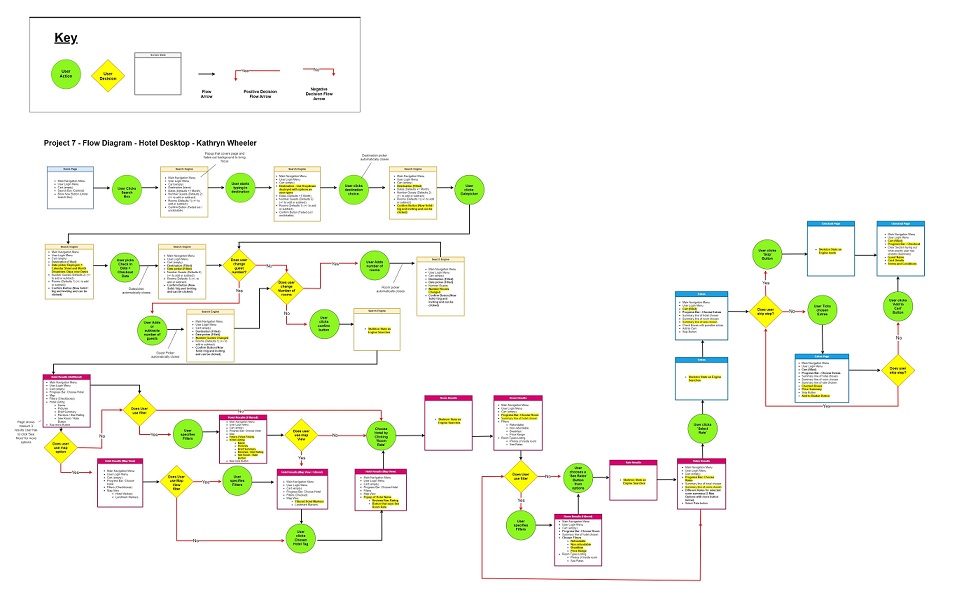
We have now reached the point of the process where we are trying to develop ideal ‘happy path’ for users. The data we have gathered should now show us a clearer picture of an ideal flow for users. We take into account the pain points and adjust the user experience accordingly. The flow diagram only takes into consideration what happens when a user interacts with the different screens, what happens next what happens if a they do this? There are many flows to consider but identifying the key flow the user will experience usually covers other scenarios as well.
Wireframing
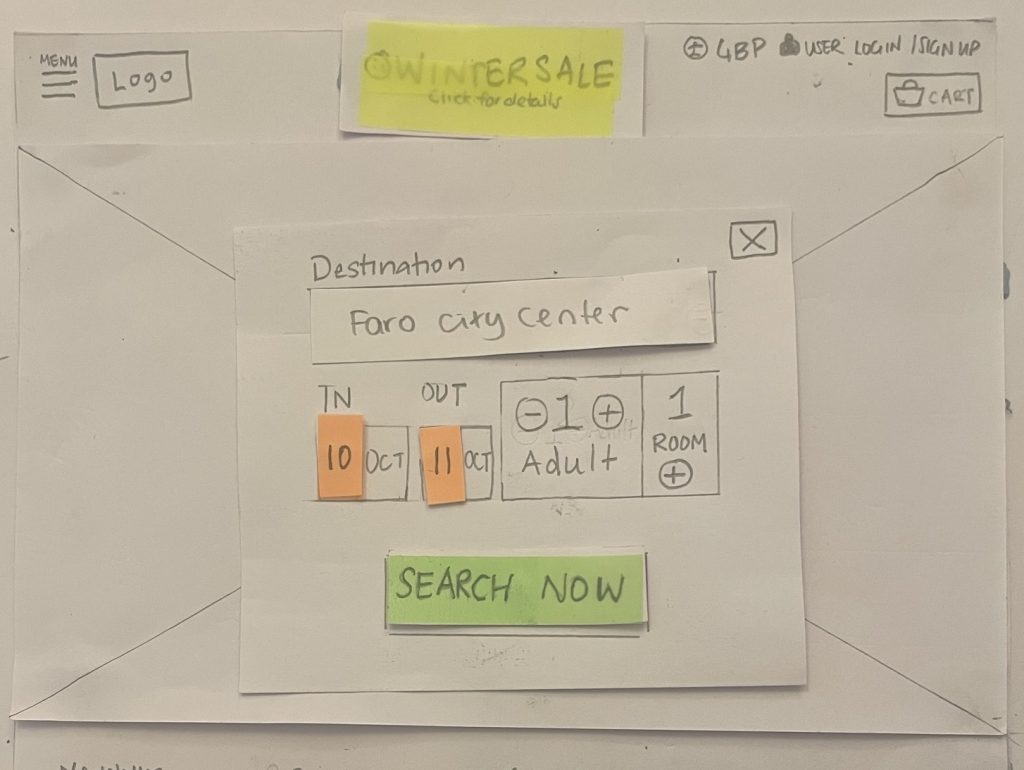
Once the user flow had been established, the design process could finally begin. If you’ve done your research properly and followed the process correctly, this part will feel almost obvious. Designs choices are made to achieve specific goals, nothing is left to chance and every aspect of the page has been placed deliberately.
It’s important that this part of the project be as hands on as possible. Pencil and paper or in my case, cutting out elements and layering them to give me the ability to move things around without having to draw the entire frame again. No aspect of the design here should have dummy text. It’s important to know how the design looks in relation to the content so that the prototype feels as realistic as possible.
Prototype
Once the wireframes had been designed and the flow figured out, then came the part to actually build the prototype. I used Figma, the industry standard. The beauty of building a prototype is that you can see the funcionality of the elements and the general flow of the user through a website. As someone who knows how to code, the ability to see how something should work before building it is a huge timesaver. I focused on making my prototype functional. Graphics like background banners or logos can always be swapped out or included in a later version of the prototype.
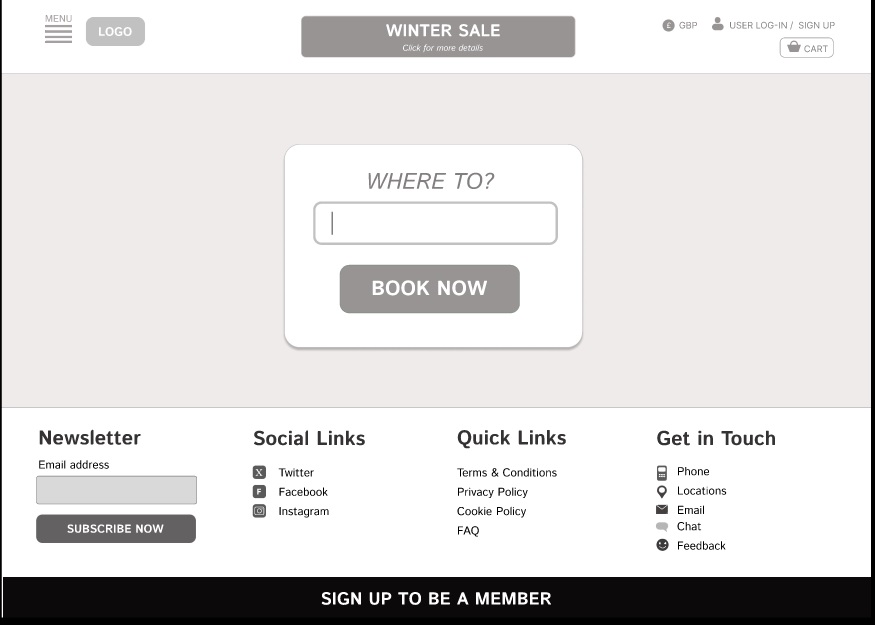
Annotations
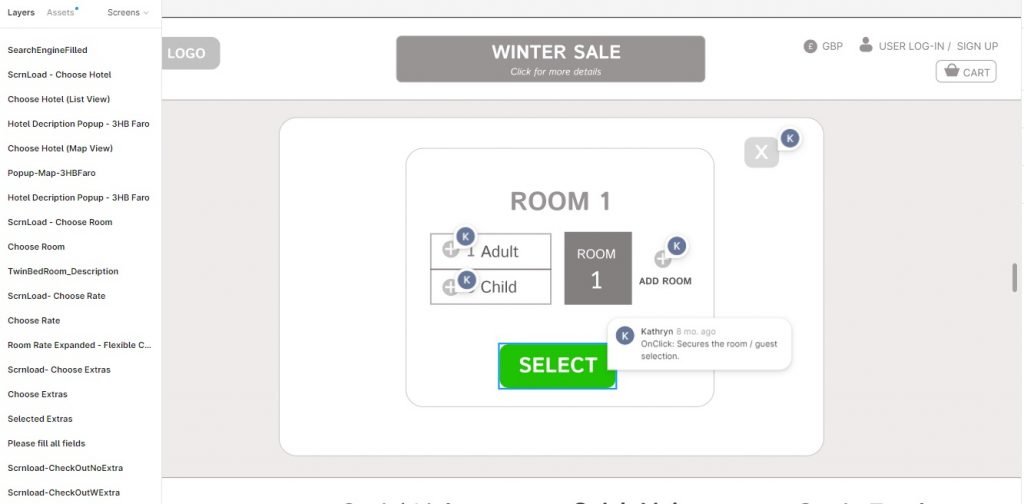
Handing over a project to developer requires extensive notes, explaining what everything should do. Usually the prototype’s functionality is self-explanatory but some aspects need more details or context.